Reliable demand estimation in Indonesia starts with scoping. A common failure mode is sizing the wrong thing, so clarify three items up front: the metric, the product scope, and the geography. Decide whether you are estimating annual revenue in USD or unit volume, and whether the scope is national, a city cluster, or a specific region like Greater Jakarta. This discipline matters because channel dynamics differ sharply across the country. For instance, Mordor Intelligence places Greater Jakarta at 34.35% of Indonesia’s retail market size in 2025, while Sulawesi is forecast to grow at an 8.75% CAGR through 2031. This type of split helps you avoid “one Indonesia” assumptions.
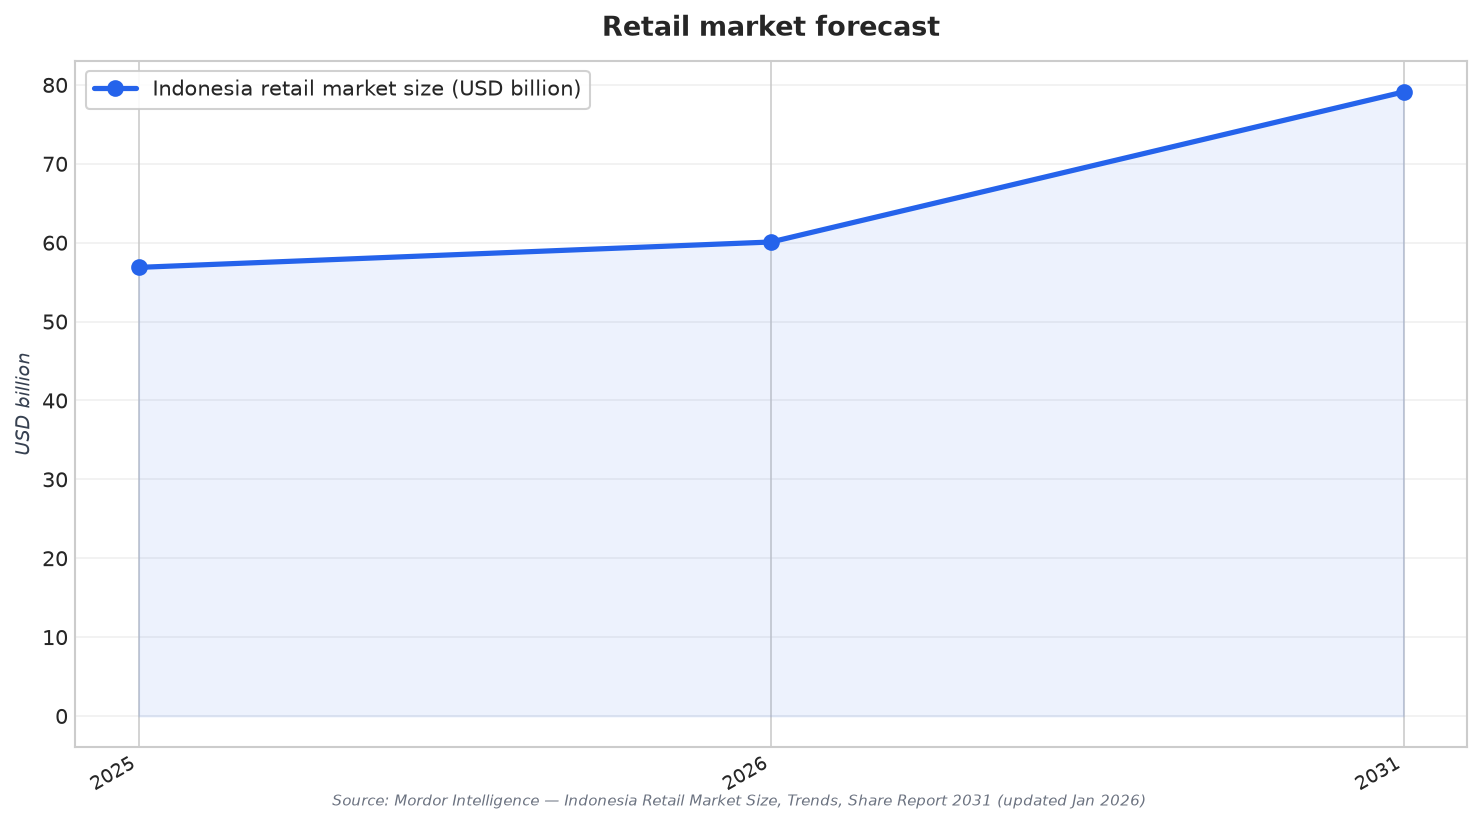
Use a top-down anchor when credible market totals exist, then break the total into segments that match your route-to-market. In Indonesia retail, Mordor Intelligence estimates the market grows from USD 56.87 billion in 2025 to USD 60.09 billion in 2026, reaching USD 79.11 billion by 2031 at a 5.65% CAGR (2026–2031). Within that 2025 base, food and beverages are 37.24% of market size, and convenience stores and minimarkets hold 42.38%. Payment mix is also a sizing lever: cash is 38.36% in 2025, while e-wallets are projected to grow at a 9.74% CAGR over 2026–2031. These ratios let you estimate addressable demand by category, channel, and payment readiness, rather than relying on a single total.
Triangulate with Bottom-Up Builds and Cross-Source Checks
Bottom-up builds are essential when traditional trade, fragmented operators, or dispersed demand patterns obscure direct measurement. Freedonia describes a ground-up model that builds the estimate from actual data such as the number of potential customers and average sales volume per customer, and notes it can be more granular and often more accurate when reliable internal or third-party data is available. Pair that with a structured five-step approach—scope, construct, assume, lock in, and extend—to keep assumptions explicit and testable. Then triangulate. For example, Technavio states Indonesia’s retail market size is valued to increase by USD 52.7 billion at a 4.8% CAGR from 2025 to 2030, and reports the offline segment was valued at USD 154.4 billion in 2024. You should not merge totals blindly, but you can use them to sanity-check directionality and identify where definitions may differ.
When you are sizing a niche that sits inside broader consumption, borrow penetration-style signals from adjacent reports and translate them into demand drivers. Ken Research highlights historical data compilation and market analysis focused on penetration rates, service-type prevalence, and revenue generation, emphasizing quality assessments and data triangulation for reliable market size estimation. It also provides two concrete demand indicators tied to consumer preferences: the market for locally sourced ingredients is projected to grow to USD 2 billion by 2029, and demand for customized, health-centric dining is projected to reach USD 1.5 billion by 2029. Even if your target is not “foodservice,” these figures can inform scenarios for health-oriented product bundles, supplier capacity planning, and willingness-to-pay hypotheses that you then test via bottom-up customer counts and basket assumptions.
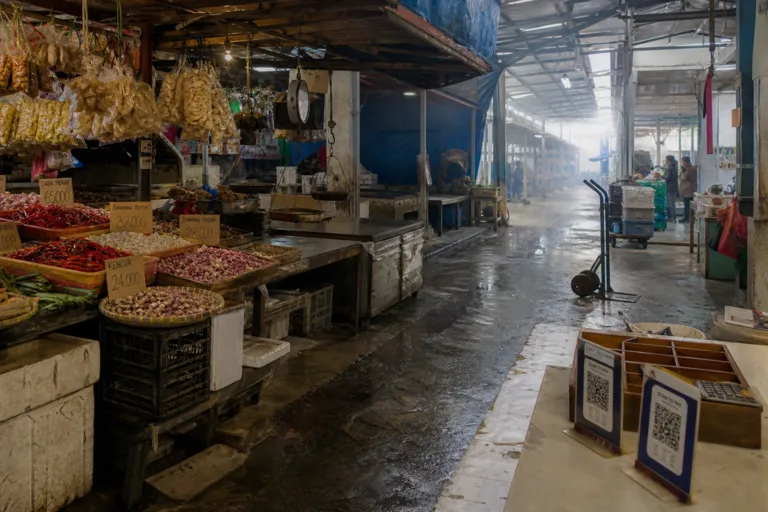
Finally, stress-test the estimate against Indonesia’s uneven development and category-specific momentum. Mordor Intelligence notes a two-speed pattern: modern trade gains from convenience and near-ubiquitous QRIS acceptance, yet traditional formats still hold most grocery transactions. It also flags that health, beauty, and personal care are forecast to expand at an 8.48% CAGR through 2031, faster than the overall retail forecast. Those signals help you choose which segments deserve more granular modeling. Good Indonesia market sizing research ends with a transparent assumption table and at least two triangulation passes—top-down segmentation plus bottom-up customer math—so stakeholders can see what is known, what is estimated, and what would change the answer.
What is the first step to size a hard-to-measure Indonesian market?
What retail figures can anchor a top-down demand estimate in Indonesia?
How do you triangulate market size when sources disagree?
How can foodservice insights help estimate demand in adjacent Indonesian categories?
What does good Indonesia market sizing research include at the end?