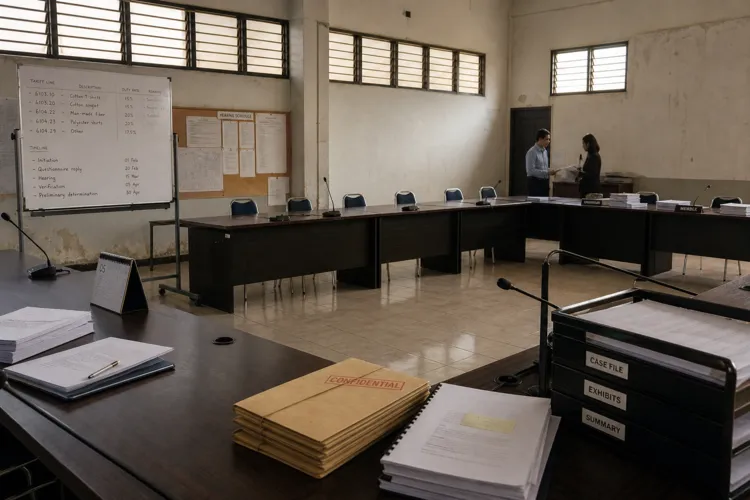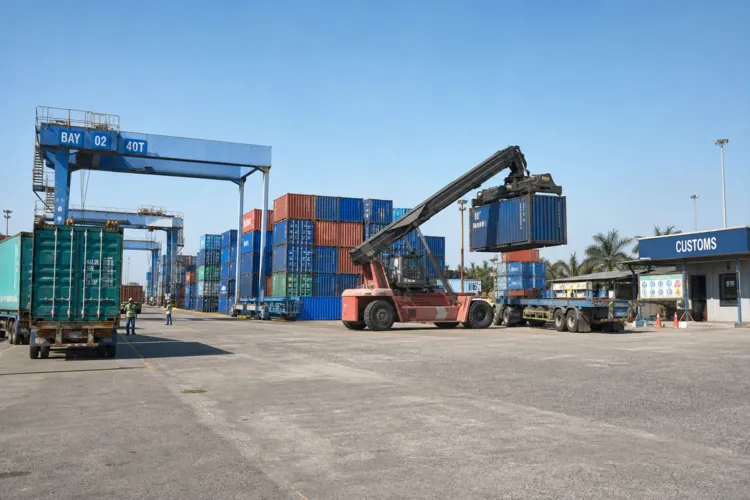

An Indonesia market entry feasibility study should start by challenging “headline credentials” with commercially observable evidence. Indonesia is often framed through big macro signals, including a population of 284 million, GDP growth of approximately 5.11 percent year-on-year in 2025, and a digital economy generating an estimated US$ 99 billion in gross merchandise value. Those figures can attract investment, but they do not prove your specific sector, geography, and business model can generate returns at acceptable risk. Benchmarking, not broad market research alone, helps you test where transactions are actually happening, which competitors operate at scale, and what unit economics are achievable given local cost structures.
Build your data plan around Indonesia’s real operating complexity. One source describes 285 million people across 17,000 islands and over 700 languages, with purchasing behavior varying by island, religion, generation, and income tier. It also warns that research scoped to Jakarta becomes “Jakarta data,” not national reality: Jakarta and Java account for 57% of GDP but only 40% of population. Your feasibility inputs should therefore be segmented, not averaged. Define which islands, channel mixes, and consumer cohorts you will serve, and collect primary research that matches that scope rather than assuming one-city learnings generalize across the archipelago.
Data-to-Assumption Discipline: What You Must Write Down
Turn research into explicit assumptions that can be debated and stress-tested. A feasibility guide recommends starting with the total addressable market (TAM) derived from industry reports, government statistics, or forecasts, then applying market-share assumptions based on competitive analysis and your unique value proposition. For Indonesia, also document pricing and willingness-to-pay logic, customer acquisition cost validation, and break-even timeline testing based on actual market data. Be careful with commonly repeated figures: one source notes the “52 million middle class” number is widely cited and frequently misapplied, and that middle-class thresholds sit well below Western equivalents, making price sensitivity acute even among aspirational consumers.
Regulatory and operational assumptions belong in the model, not in footnotes. Indonesia’s investment environment has been materially reformed through the Omnibus Law on Job Creation (Law No. 11 of 2020) and a shift from a Negative Investment List to a Positive Investment List under Presidential Regulation No. 10 of 2021, amended by Presidential Regulation No. 49 of 2021. This change opened more than 200 business sectors to 100 percent foreign ownership that were previously restricted. Your go/no-go prep work should include verifying the foreign ownership cap for your KBLI code and mapping licensing steps through the OSS risk-based system administered by BKPM (now the Ministry of Investment).
Finally, define go/no-go gates that connect Indonesia realities to board-level decisions. Use financial modeling based on Indonesian market data to estimate investment needs, operating costs, revenue potential, and expected returns, and confirm whether the model can perform sustainably given market conditions, regulatory requirements, operational readiness, and financial viability. Include currency planning if your costs are in IDR: one business brief cites an exchange rate of approximately 1 USD = 17,592 IDR, underscoring why local-currency budgeting matters. Gate examples include: failing to validate willingness-to-pay at the target price point; an OSS licensing path that cannot meet your timeline; or a channel strategy that ignores traditional trade outside major urban centers.
What is the purpose of an Indonesia market entry feasibility study?
Which Indonesia figures can be used as starting context, not proof of fit?
Why is Jakarta-only research risky for market entry decisions?
What regulatory checkpoints should be built into go/no-go gates?
What is one currency-planning fact to include in the financial model?