Indonesia entered 2026 with strong top-line growth, but pricing conditions became choppy as the year progressed. GDP growth reached 5.61% year-on-year in Q1 2026, and household consumption remained the primary engine, supported by seasonal momentum from Ramadan and Eid festivities. Yet financial-market stress arrived at the same time, with the rupiah weakening toward IDR 17,950–18,000 per USD in June 2026 and the Jakarta Composite Index falling sharply from its peak. Those cross-currents matter for purchasing power, because currency moves can raise costs for imported items even when domestic activity looks firm.
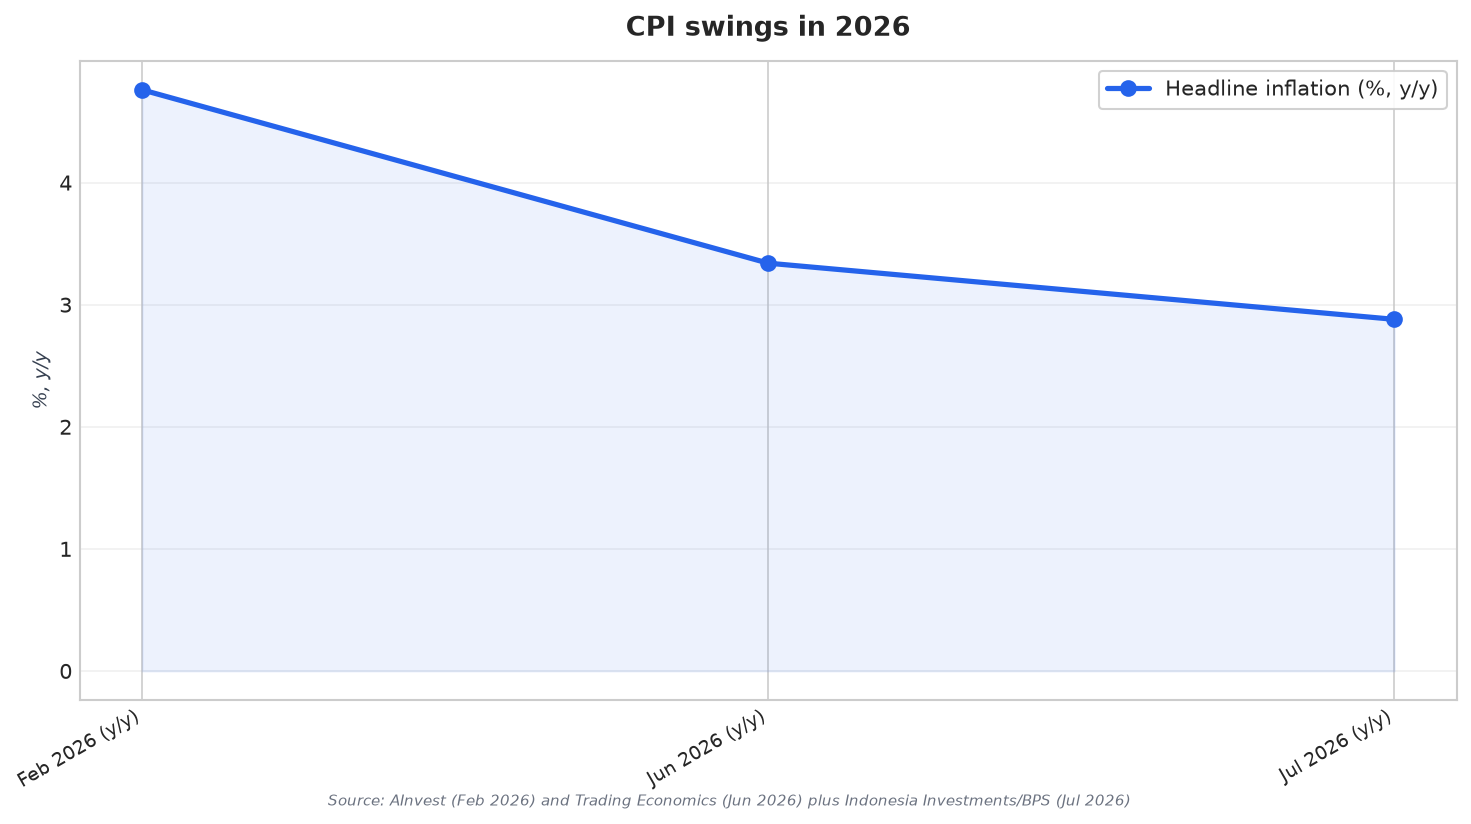
Early 2026 also showed how fast inflation can accelerate before cooling. Headline inflation surged to 4.76% in February 2026, and core inflation accelerated to 2.63%, described as the strongest since May 2023. By June, annual inflation was still elevated at 3.34% year-on-year, up from 3.08% in May, and it sat within Bank Indonesia’s 1.5%–3.5% target corridor. Trading Economics also noted June’s pressures across many components, while the policy response turned tighter: one reference point shows a BI policy rate of 5.25% in May 2026, while another report cites the benchmark rate reaching 5.75% on June 18 after back-to-back hikes.
Why July’s Mild Deflation Was Not a Simple “Demand Crash” Signal
The clearest “deflation” moment in the 2026 price narrative came in July. Statistics Indonesia (BPS) reported that CPI fell 0.14% month-on-month in July 2026, reversing June’s 0.44% monthly increase. Annual headline inflation eased from 3.34% year-on-year in June to 2.88% in July, and year-to-date inflation accumulated to 1.65% through July. The composition matters for interpreting Indonesia deflation 2026 themes: food, beverages, and tobacco recorded 0.89% deflation month-on-month, linked to the secondary harvest season (July–September), and personal care and other services also contracted 0.89% month-on-month, attributed to declining gold jewelry prices in line with softer global gold markets.
At the same time, “deflation” did not mean underlying price pressures disappeared. Core inflation held at 2.76% year-on-year in July, and later data showed core inflation rose to 2.92% in August, the highest level since March 2023. Monthly CPI also rebounded by 0.21% in August, reversing July’s 0.14% decline. This mix is a practical clue for consumer demand: headline prices can dip when volatile items like food and gold fall, while core remains firm as services and stickier categories keep moving. For planners, that is a reminder to separate temporary relief from a broad-based slowdown.
Beyond groceries, demand signals looked softer in interest-rate-sensitive segments. In residential property, primary-market sales contracted 25.67% year-on-year in Q1 2026, reversing 7.83% growth in Q4 2025, and Bank Indonesia’s survey showed average mortgage rates of 7.42% in Q1 2026, unchanged from Q4 2025, with repricing expected to feed through later as tightening begins. Meanwhile, the currency backdrop stayed volatile: one report cited an intraday low of 18,209 per USD on June 9 and later stabilization in the 17,700–17,800 range. Together, these swings suggest consumer behavior in 2026 could split between essentials benefiting from seasonal supply and categories more exposed to financing costs and imported-input prices.
What drove Indonesia’s July 2026 deflation?
Did core inflation fall when headline CPI turned negative in July?
How does the Indonesia deflation 2026 episode relate to consumer demand?
What happened to inflation between February and July 2026?
What other 2026 indicators hinted at demand stress outside everyday consumption?