Indonesia opened 2026 with resilient investment momentum despite global pressure from trade tensions, geopolitical friction, and broader economic uncertainty. In Q1 2026, total investment realization reached IDR 498.8 trillion, up 7.2% year-on-year versus IDR 465.2 trillion in Q1 2025, and up 0.4% quarter-on-quarter from Q4 2025. The Q1 result also represented 24.4% of the government’s full-year 2026 target of IDR 2,041.3 trillion. Inside that headline, foreign direct investment (FDI/PMA) reached IDR 250.0 trillion, rising 8.5% year-on-year and accounting for 50.1% of total investment, while domestic investment (PMDN) totaled IDR 248.8 trillion, up 6.0% year-on-year, or 49.9% of the total.
The mid-year picture reinforces the pattern and adds a location signal. In the first half of 2026, investment realization reached Rp1,010.6 trillion (US$56.1 billion), up 7.2% from a year earlier, and created 1.44 million jobs. The regional split also tightened: Java attracted Rp502.8 trillion, or 49.8% of total investment, while regions outside Java received Rp507.8 trillion, or 50.2%. For investors watching allocation risk, that near-even split matters. It suggests capital is not concentrating solely on the traditional core, aligning with the government’s stated effort to support more balanced regional development.
Where the Foreign Capital Is Coming From—and Why Rankings Are Shifting
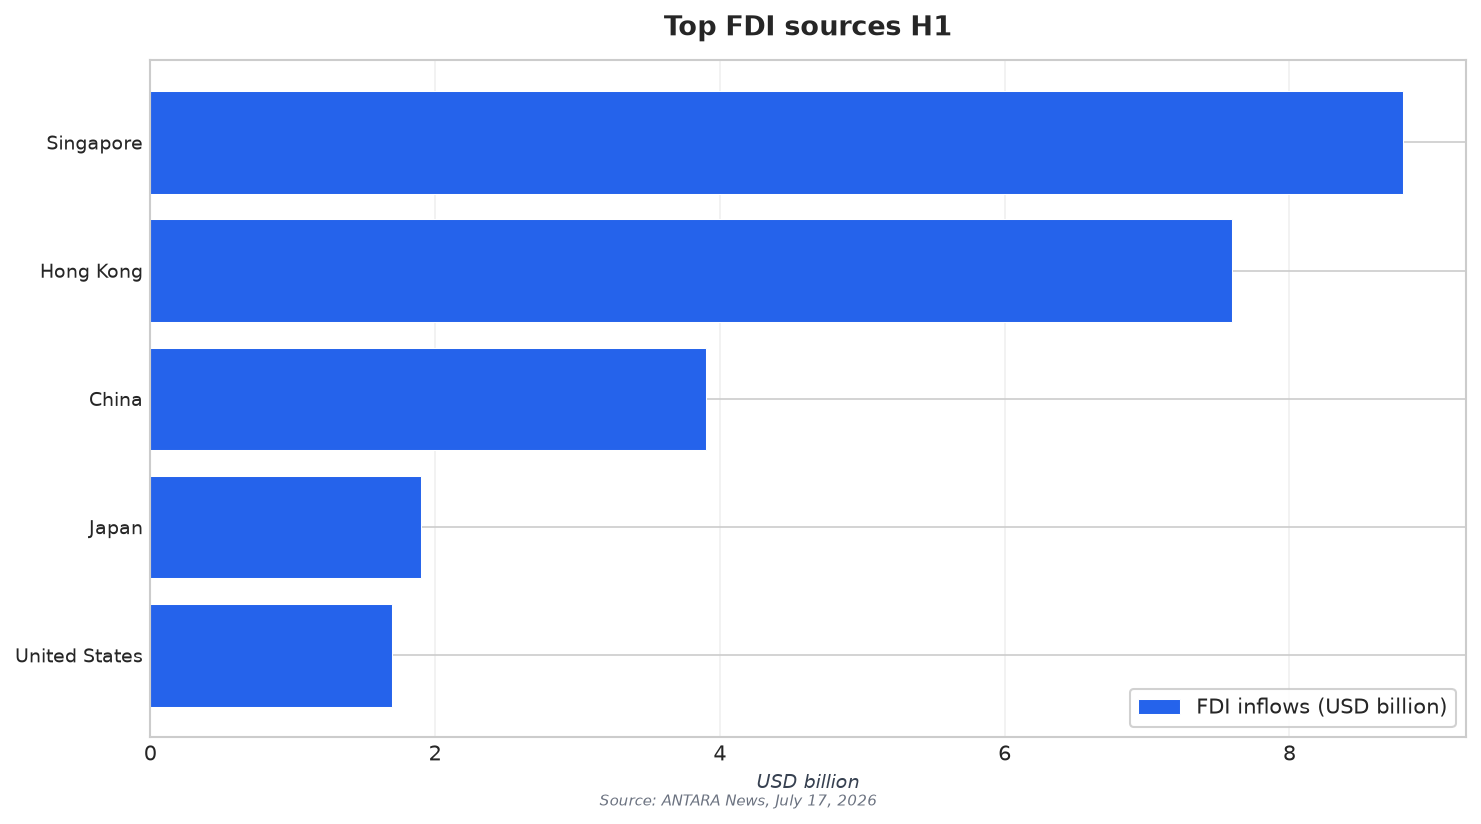
Source-country data shows both continuity and a nuanced shift in how capital is routed. In Q1 2026, Singapore ranked first with USD 4.6 billion, followed by Hong Kong at USD 2.7 billion and China at USD 2.2 billion; the United States contributed USD 1.3 billion and Japan USD 1.0 billion. But the combined Hong Kong and mainland China total was approximately USD 4.9 billion in Q1 2026, a reminder that “Greater China” capital can be larger than any single jurisdiction’s line item. By H1 2026, Singapore remained the largest foreign investor with US$8.8 billion, followed by Hong Kong (US$7.6 billion), China (US$3.9 billion), Japan (US$1.9 billion), and the United States (US$1.7 billion), and these five economies accounted for about 77.8% of Indonesia’s total FDI in the first half.
Another visible flow signal is where foreign investors are landing within Indonesia, at least in early 2026. West Java was the most popular destination for foreign investors in Q1 2026, attracting $3.1 billion in the first three months. Meanwhile, the second quarter added detail on sector rotation and routing behavior. In Q2 2026, FDI realization was IDR 257.7 trillion (about USD 14.3 billion), representing 50.4% of total direct investment, while domestic direct investment was IDR 254.1 trillion (about USD 14.1 billion), or 49.6%. The report also noted that the government changed its conversion rate used to calculate FDI figures from IDR 16,000 per US dollar in 2025 to IDR 16,500 per US dollar in 2026, meaning part of the expansion reflects that updated multiplier.
So what do these Indonesia FDI trends 2026 signal in practical terms? First, foreign capital is consistently making up about half of realized investment, quarter after quarter, which indicates sustained appetite rather than a one-off spike. Second, investor geography is best read as a network: BKPM data can show holding-company hubs such as Singapore or Hong Kong even when the operating capital is ultimately tied to mainland corporate groups. Third, flows are not only sector-led but also location-led: West Java’s Q1 destination lead and the H1 near-50/50 Java versus outside-Java split point to a market where investors can no longer assume that “Indonesia opportunity” means only one island or one corridor.
How much investment did Indonesia realize in Q1 2026, and how fast did it grow?
How balanced were foreign and domestic investments in early 2026?
Which locations in Indonesia attracted the most investment in 2026 so far?
What do the Indonesia FDI trends in 2026 suggest about source-country rankings?