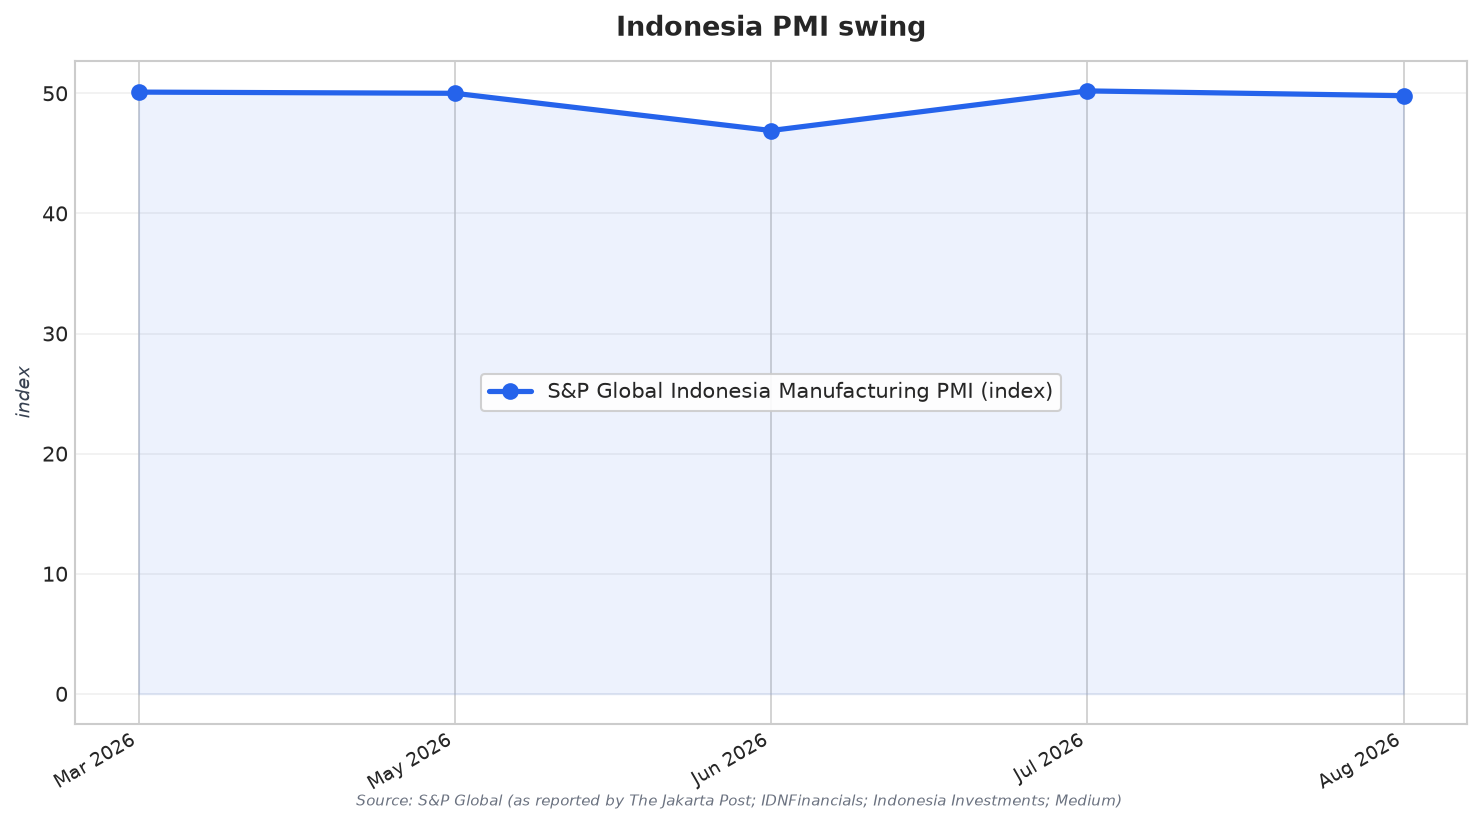
Indonesia’s factory pulse in 2026 tells a story of abrupt momentum shifts rather than a smooth cycle. In March 2026, S&P Global’s Manufacturing PMI fell from 53.8 to 50.1, a move that still signaled expansion but only barely. By June, the index had plunged to 46.9 points, below the 50 threshold that separates growth from contraction. That swing matters for industrial investors because PMI is built from purchasing managers’ near-term decisions and order pipelines, which can flag changes in operating conditions earlier than many backward-looking indicators.
When PMI drops into contraction, the sources describe a consistent pattern: weaker demand and a pullback in production and staffing. In June 2026, S&P Global noted that new orders fell for the first time in three months and at the fastest pace in a year, and the renewed decline in new orders led to the sharpest fall in output volumes since April 2025. Companies significantly reduced their workforce and purchasing activity, and inventories also declined in line with weakening demand. S&P commentary also described price pressures as historically elevated in that period, with increases in average cost burdens tied to higher raw material prices.
How to Read the 50 Line: Signals Hidden Behind the Headline
The midyear contraction did not end the story. In August, the PMI slipped back below 50 again after a brief move above the line: S&P Global’s Indonesia Manufacturing PMI fell to 49.8 in August from 50.2 in July. The Jakarta Post described broadly stable business conditions midway through the third quarter, but also pointed to renewed declines in output and employment as the key drags. Production had decreased in five of the past six months, and employment had also declined in five of the past six months, as some manufacturers cut payrolls due to lower production requirements while others struggled with staffing levels amid voluntary resignations.
For investors, the most investable information is often the mix of subcomponents rather than the PMI point alone. August showed this clearly: new orders rose slightly for the first time in three months, with the seasonally adjusted index moving just above 50, signaling broadly stable new work instead of a strong rebound. Yet output still fell, with companies citing stronger competition, subdued demand, and higher input costs. Archyde also framed the August contraction as a reduction in new orders, shrinking output, and cautious hiring practices, while domestic demand softened and export markets remained sluggish amid persistent global economic uncertainty.
These swings shape how industrial capital is priced and timed. Archyde noted that manufacturers were cutting back on inventory purchases while waiting for clearer signals from global central banks, and warned that waiting too long could leave firms flat-footed if demand rebounds. The same source said global portfolio managers watch Indonesian factory data as a proxy for domestic consumer health, linking contraction to tighter credit conditions that can squeeze middle-class spending power. It also noted that foreign direct investment into industrial estates outside Jakarta depends heavily on predictable production metrics, which is why the September and October PMI prints were highlighted as key near-term checkpoints.
What does a PMI reading below 50 mean for Indonesian factories?
How did Indonesia’s PMI move from March to June 2026?
Which components weakened when PMI contracted in mid-2026?
What did the August 2026 PMI say about output, jobs, and new orders?
How should investors interpret Indonesia’s manufacturing PMI in 2026 when planning capital deployment?